신안 도서해역 퇴적물의 중금속 함량 및 분포
초록
신안 도서해역 주변 퇴적물의 중금속 함량과 분포를 파악하기 위해 40개 표층퇴적물을 채취하여 입도와 유기탄소 및 중금속(Al, Fe, Li, Cu, Pb, Zn, As, Co, Cr, Hg)을 분석하였다. 입도는 -0.37~6.65Ø 범위로 공간적으로 변화가 컸으며 섬에서 멀어질수록 조립하였다. 총유기탄소의 함량 또한 0.07~1.18% 범위로 큰 폭의 변화를 보였으며, 그 평균은 0.45%로 육지에 인접한 연안 퇴적물에 비해 현저히 낮았다. 중금속의 함량은 국내 해저퇴적물 ‘주의’ 기준보다 낮은 가운데 그 분포는 공간적으로 변화가 큰 금속(Cr, Zn, Cu, Li, Fe, Hg, Al)과 비교적 작은 금속(Pb, As, Cd)으로 구분되었다. 전자의 원소들은 퇴적물의 입도분포와 양호한 관련성을 갖는 반면 후자는 탄산염과 같은 특정 지화학성분의 영향을 반영하였다. 배경농도를 기준으로 한 중금속 농축을 파악하기 위해 선형회귀분석과 누적빈도곡선에 의해 연구지역의 배경농도를 추산하였으며, 그 결과 농축정도는 배경농도보다 전반적으로 낮은 가운데 일부 시료에서 다소 높은 Pb, Cd 및 As 함량이 확인되었다.
Abstract
In order to understand the distribution of sediments and the content of heavy metals on the seabed of Shinan Island, 40 surface sediments were collected and analyzed. The analysis was conducted on particle size, organic carbon, and some heavy metals (Al, Fe, Li, Cu, Pb, Zn, As, Co, Cr, and Hg). The grain size of the sediment changed greatly from -0.4Ø to 6.7Ø, and as the distance from the island increased, sediments with coarse particles were distributed. The content of total organic carbon also changed significantly, ranging from 0.07% to 1.18%, and the average was 0.45%, which was significantly lower than that of sediments adjacent to the land coast. The content of heavy metals was lower than the domestic standards TEL for marine sediment, and their distribution was grouped into spatially varying metals (Cr, Zn, Cu, Li, Fe, Hg, Al) and relatively small metals (Pb, As, Cd). The former showed a relationship with the grain size distribution of sediments, while the latter reflected the influence of certain geochemical components such as carbonate. In order to understand heavy metal enrichment based on the background concentration, the background concentration of the research area was estimated by linear regression analysis and cumulative frequency curve. As a result, the concentration level was generally lower than the background concentration, and some samples showed somewhat higher Pb, Cd, and As contents.
Keywords:
Sediments, Grain size, Total organic carbon, Heavy metals, Background concentration키워드:
퇴적물, 입도, 총유기탄소, 중금속, 배경농도1. 서 론
한반도 서남해의 신안해역은 유인도 74개와 무인도 951개로 이루어진 전형적인 다도 해안으로 해안선의 굴곡이 심하고 불규칙하며, 평균수심 약 15 m 내외의 중조차 천해 퇴적환경이다(Shinangun[2021]). 섬과 섬 사이는 주수로인 조하대를 제외하면 접근이 쉬운 넓은 조간대 갯벌이 발달해 있으며, 육상의 연장 공간으로서 갯벌을 이용하는 다양한 인간활동이 지속적으로 증가하고 있다. 이 지역에서 이루어진 방조제, 항만 및 연육교 건설, 간척 및 매립에 의한 중소규모 해안 개발, 연안양식 및 각종 해상활동은 끊임없이 가중되어 자연의 훼손과 함께 환경오염을 유발하고 있다(Chang et al.[2007]; Ryu et al.[2009]; Hwang et al.[2010]).
인간활동에 의한 해저 퇴적물의 오염은 단기적이고 주로 현지성인 수질오염과 달리 물질 근원지의 특성을 포함한 중장기적인 역사를 반영한다(Horowitz[1991]). 개발 및 산업화에 의한 영향이 비교적 큰 우리나라 연안해역의 퇴적물 연구는 주로 중금속을 중심으로 수체에서 흡착, 공침에 의한 축적과 함께 유입원으로부터 이동의 역사를 추적, 파악함으로써 인간활동의 강도에 따른 장기간의 인위적 농축과정을 다루고 있다(Youn et al.[1999]; Cho et al.[2000]; Hyun et al.[2003]; Song et al.[2011]; Jeon et al.[2012]; Hwang et al.[2013a]; Cho and Cho[2015]; Choi et al.[2015]). 그러나 퇴적물에서 중금속 오염의 기록은 혼재된 물질의 다양성뿐만 아니라 입도의 차이 때문에 근원지 물질의 속성이 희석되어 대체로 무질서하고 혼탁한 경향을 나타낸다(Horowitz[1991]; Song and Choi[2017]). 그러한 까닭에 오염의 흔적을 판별하기 위해서는 해당 퇴적물에 적용할 최적의 기준을 설정하는 일이 무엇보다 중요하다.
퇴적물의 중금속 오염을 평가하기 위한 기준값 즉, 배경농도의 선정은 일반적으로 퇴적물의 기원을 육지 암석의 풍화, 침식에 근거한 셰일 및 지각의 평균함량(Turekian and Wedepohl[1961]; Martin and Whitfield[1983]), 인위적 영향이 배제된 산업화 이전 퇴적물이 갖는 함량, 그리고 보존성 원소에 대한 상대비에 근거하였다. 그러나 퇴적지의 배경농도는 퇴적물의 공급원과 퇴적환경의 다양한 조건에 따라 국지적으로 차별화된 특성을 반영하는 까닭에 고유성을 갖는 특정 지역에 광역적 기준값을 적용해도 되는가에 대한 검토가 필요하다. 그러한 측면의 여러 사례연구는 배경농도 설정에 대한 새로운 접근을 제시하고 있다(Siegel[1995]; Matschullat et al.[2000]; Newman and Watling[2007]; Lim et al.[2007]; Teng et al.[2009]; Song et al.[2014]; Cho and Cho[2015]; Song and Choi[2017]; Joe et al.[2018]).
신안해역 퇴적물의 중금속 오염연구를 통해 제시되는 배경농도는 지역의 중금속 유출 및 축적의 역사를 이해할 수 있는 단초를 제공할 것이다. 연구지역에 합당한 국지적 기준을 마련하기 위해 본 연구는 지역 퇴적물에서 대표적인 보존성 금속을 파악하여 선형회귀분석과 누적빈도곡선에 의한 통계적인 방법으로 배경농도를 산출하고, 아울러 수종 중금속의 오염도를 판단하였다.
2. 재료 및 방법
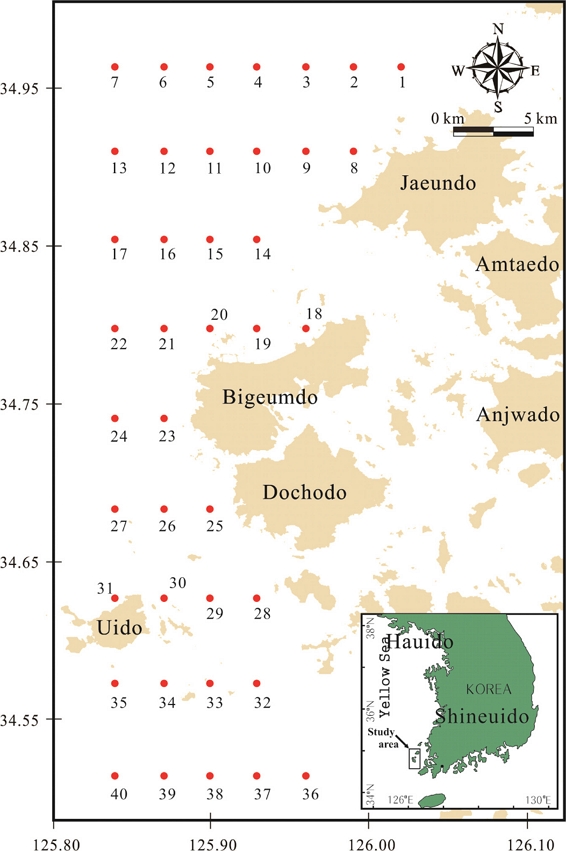
연구지역 신안군 자은도 및 비금·도초도 주변해역은 비금도 원평항을 기준으로 173~374 cm 조차가 관측되는 중조차 퇴적환경으로 평균수심 20~30 m의 조하대와 조간대 갯벌로 이루어져 있다. 창조류는 북쪽, 낙조류는 남쪽 방향으로 최강유속 약 220~230 cm/sec의 속도로 비교적 강하게 흐른다(KHOA[2019]). 이 해역에서 퇴적물의 중금속 연구를 위해 남북으로 총 40개의 표층퇴적물을 채취하였으며, 입도 및 지화학 분석을 위한 시료로 분리하여 습식 처리와 건조, 분쇄 등 각 분석에 필요한 처리를 추가하였다(Fig. 1).
퇴적물의 입도는 Ingram[1971]의 표준입도분석법에 따라 4Ø 보다 조립한 성분은 건식체질로, 4Ø 보다 세립한 성분은 Stokes 법칙에 의한 피펫팅 방법으로 분석하였다. 입도성분 및 조직변수는 각 Ø별 무게 백분비로부터 Folk and Ward[1957]의 방법으로 구하였다. 총유기탄소(TOC)는 퇴적물 시료에 1M 염산을 넣어 무기탄소를 제거한 후, 고온 연소과정에서 발생하는 이산화탄소를 측정하는 유기탄소분석기(SHIMADZU; SSM-5000)로 분석하였다. 탄산칼슘(CaCO3)의 함량은 먼저 총무기탄소를 탄소분석기(SSM-5000)로 정량한 후 탄소에 대한 탄산칼슘의 비를 통해 산출하였다. 퇴적물의 중금속은 시료를 혼합산(HNO3+HF+HClO4)으로 분해, 용출한 용액을 원자흡광분석기(AAS, Perkin Elmer Model-PinAAcle 900)로 측정하였다. 측정된 10개(Al, Fe, Li, Cu, Pb, Zn, Cr, As, Cd, Hg) 금속은 표준물질 NRC(National Research Council of Canada)의 PACS-2(n=2)를 시료와 동시에 분석하여 측정값을 검증하였으며, 측정의 회수율(상대오차)은 94(Cu)~110%(Cr) 범위를 보였다.
3. 결과 및 고찰
3.1 입도 및 유기물 함량
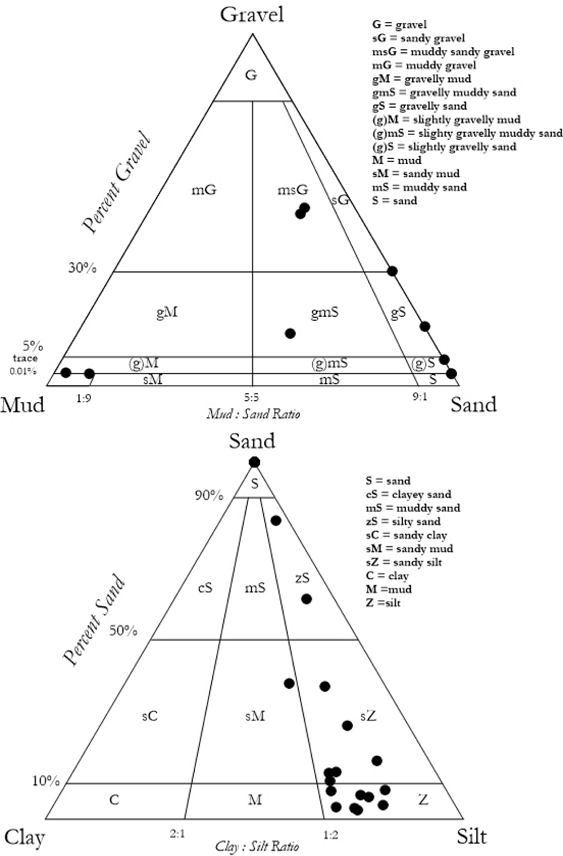
퇴적물의 입도는 점토의 함량이 낮고 모래가 우세한 가운데 정점간 차이가 컸다(Fig. 2). 조립성분 중 자갈의 함량은 최대 48.6%(평균 3.9%), 모래는 2.6~100%(평균 55.9%)로 두 성분의 함량이 전체의 약 60%를 차지하였다. 85% 이상이 모래로 된 사질(S), 역질사(gS), 약역질사((g)S) 및 실트질사(zS) 퇴적상은 섬에서 떨어진 해역에 산재하였고, 니질의 함량이 85% 이상인 실트질(Z), 사질실트(sZ), 약역질니((g)M) 퇴적상은 주로 섬과 가까운 해역에 분포하였다(Fig. 3). 한편, 자갈이 30% 이상 포함된 가장 조립한 니사질역(msG), 사질역(sG) 퇴적상은 수심이 깊은 수로에 분포한다.
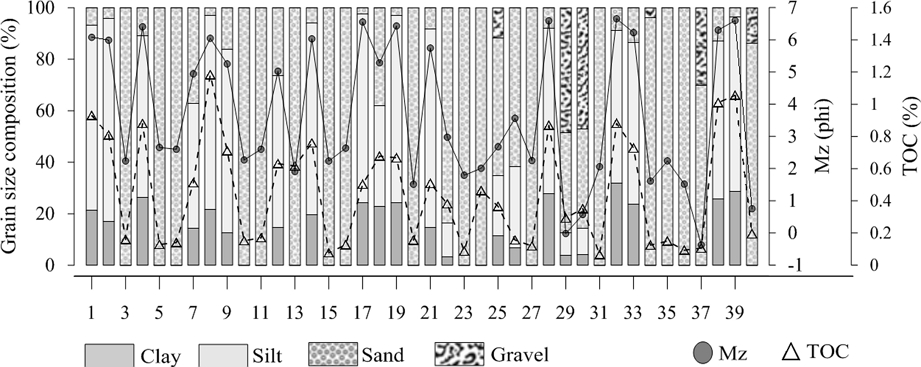
Grain size composition, mean-grain size (Mz) and total organic carbon (TOC) content of each sediment sample.
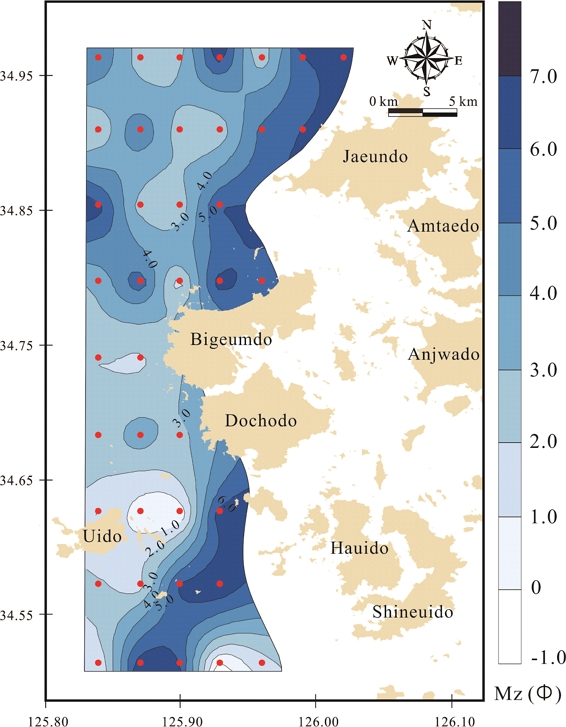
평균입도는 -0.37~6.65Ø의 범위로 입도의 변화가 비교적 컸다. 평균입도 6Ø 이상의 세립 퇴적물은 비금-도초도의 남북방향으로 길게 발달하며, 수심이 깊어지는 외해역으로 갈수록 조립해지는 경향을 보인다. 일반적으로 고에너지 환경에 노출된 퇴적물은 대개 2.7Ø 이하의 조립한 입도가 우세한 경향을 나타내는데(Sly et al.[1983]) 연구지역의 평균입도 분포는(Fig. 4) 비교적 강한 조류의 영향을 반영한 것으로 판단된다.
TOC는 0.07~1.18% 범위로 평균 0.45%(±0.33%)에 비해 함량의 변화가 컸으며, 모래가 우세한 지역에 비해 니질성분이 풍부한 정점에서 0.5% 이상의 함량을 나타내 대체로 퇴적물의 입도와 밀접한 관련성을 보였다(R2=0.70, p<0.01). 평균함량 0.45%는 도암만의 ½, 고성만의 ¼, 통영연안의 ⅕ 수준에 해당되는 낮은 값이다(Cho and Cho[2015]; Lee et al.[2017]; Hwang et al.[2021]). 일반적으로 연안퇴적물의 유기물 함량은 입도 외에도 육지로부터의 유입, 해역의 생산성, 인간활동에 의한 영향을 반영한다(Horowitz[1991]; Mayer[1994]; Ganeshram et al.[1999]). 그러나 육지와 격리된 도서 환경, 조립한 입도, 양식을 비롯한 빈약한 해상활동 등은 유기물 함량이 낮은 본 연구지역에 해당되는 조건으로 육지와 접한 타 연안해역의 퇴적환경과 비교된다(Table 1).
3.2 퇴적물의 중금속 함량
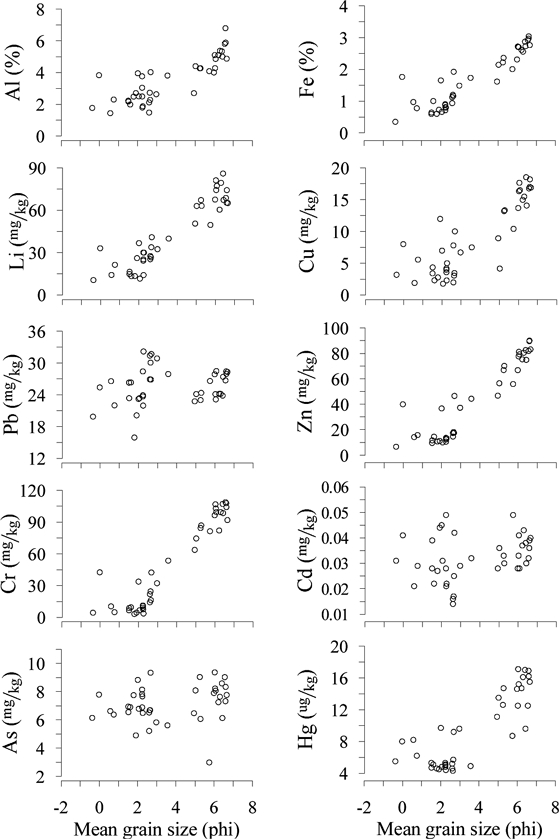
연구해역에서 중금속 함량은 Pb와 As를 제외하면, 타 지역에 비해 현저히 낮았고(Table 1), Zn은 절반 수준이었다. 정점간 함량 변동()은 Cr(83%), Zn(71%), Cu(65%), Li(56%), Fe(52%), Hg(49%), Al(40%), Cd(27%), As(18%), Pb(13%) 순으로 크며, 특히 입도와 관련성을 보이는 금속들(Cr, Zn, Cu, Li, Fe, Hg, Al)에서 40% 이상으로 비교적 변화가 컸다. 중금속 원소들의 함량 분포는 입도 분포와 비슷하게 전반적으로 퇴적물의 세립성분이 우세한 연구지역의 동쪽에서 함량이 높고 서쪽의 외해 방향으로 낮아지는 경향을 보여, 대부분의 금속원소 함량이 퇴적물의 입도에 의해 조절되는 것으로 해석된다. 한편, Pb 및 As는 4.0Ø 이하의 조립 퇴적물에서도 전체적으로 비슷한 수준의 함량을 나타냈으며, Cd는 높은 탄산칼슘 함량(12.9~78.6%)을 포함하는 조립 퇴적물에서도 비교적 높은 함량이 유지되었다.
퇴적물의 중금속은 입도 의존적인 입자의 광물조성과 표면적, 철·망간산화물 및 유기물 성분, 양이온교환용량 등과 같은 제반 물리·화학적 요인의 영향을 받는 까닭에 일반적으로 입도와 양의 상관관계를 갖는다(Salomons and Förstner[1984]; Klamer et al.[1990]; Horowitz[1991]). 이러한 입도 의존적 관계는 연구지역 퇴적물에서도 확인되며 Al, Fe, Li, Cu, Zn, Cr 및 Hg 등은 입도가 세립 해질수록 함량이 증가한다(Fig. 5). 반면에 Pb 및 As는 평균입도 4.0Ø를 기준으로 조립시료와 세립시료에서의 함량비가 1.0~1.1 배로 입도에 따른 차이가 거의 없으며, 일부 조립 퇴적물에서 Cd 함량은 시료 전체의 평균보다 더 높다. 즉, 입도 세립화의 집적효과에 상응하는 금속의 함량이 세립성분에 의해서 조절되지 않은 임의의 결과를 보여준다. 인접한 도암만 퇴적물의 중금속 존재형태별 연구는 조립질에서 우세한 탄산염 성분의 현저한 영향을 제시한 바 있으며, 특히 Cd 존재비는 탄산염추출부분이 평균 70.6%(48~90%)를 차지하였다(Cho[2021]). 특정 중금속과 탄산염의 관련성은 세립성지화학성분이 갖는 흡착력 외에 타 원소와 치환작용에서 비롯될 수 있다. Cd를 비롯한 Pb, Mn, Co 등은 칼슘이온과 치환되어 탄산염 물질에 자생적으로 축적될 수 있으며(Kitano et al.[1980]; Pedersen and Price[1982]; Billon et al.[2002]; Wang et al.[2010]), 이온치환에 의한 존재 가능성이 주변 퇴적물의 여러 존재형태별 연구에서도 확인된다(Zhang et al.[1988]; Cho et al.[1994]; Cho[2021]). 따라서 본 연구에서 Cd는 이러한 높은 탄산염 함량과 관련이 있는 것으로 추정된다.
3.3 중금속의 배경농도 설정 및 평가
중금속의 자연적 배경농도는 기반암의 풍화와 침식에 의한 자연 기원 물질의 바탕농도로서 퇴적물을 구성하는 광물 자체가 갖는 농도로 완성된다. 그러나 특정 퇴적지의 퇴적물은 입도에 따른 광물분화와 자생 유기물, 탄산염 등 다양한 퇴적환경 요소에 의한 제반 자연현상의 융합체로 존재한다(Matschullat et al.[2000]). 따라서 일정 해역의 배경농도는 환경 고유의 특성을 반영함과 동시에 인위적인 오염의 영향이 배제되어야 한다. 주변 연안과 해역의 개발 흔적이 없는 연구지역 퇴적물은 위 조건에 부합하며, 연구해역 퇴적물에서의 금속 함량은 우리나라 오염관리수준(「해양환경관리법」 제8조, 주의 기준: Cu 20.6mg/kg, Pb 44.0mg/kg, Zn 68.4mg/kg, Cd 0.75mg/kg, As 14.5 mg/kg, Hg 0.11 mg/kg, Cr 116 mg/kg) 이하로 비오염의 합리적 기준을 충족한다. 이에 본 연구에서는 선형회귀분석(linear regression analysis)과 누적빈도곡선(cumulative frequency curve)에 의한 방법으로 연구지역의 배경농도를 도출하였다.
선형회귀분석은 보존성금속 CN과 대상금속 CM 간의 관계 즉 CM=aCN+b로부터 얻는 방식으로, 독립변수로서 보존성금속의 선정이 중요하다. 많은 연구에서 조건을 만족하는 보존성금속으로 Al, Fe, Li, Cs 등이 제시되어 왔다(Klamer et al.[1990]; Luoma[1990]; Summer et al.[1996]; Lim et al.[2007]; Cho and Cho[2015]; Woo et al.[2019]). 본 연구에서는 배경농도 산정을 위한 보존성금속으로 평균입도 및 금속 간의 상관성 및 유효성을 고려하여 Al을 선정하였고, 회귀직선식을 통해 대상금속의 함량을 산출하였으며, 관측값에 대해 95% 신뢰구간을 벗어난 시료들은 이상치로 처리하였다(Fig. 6, Table 2). 단, 보존성금속과 관련성이 낮은 Pb, As 및 Cd는 선형회귀분석을 통한 산정에서 제외하였다.
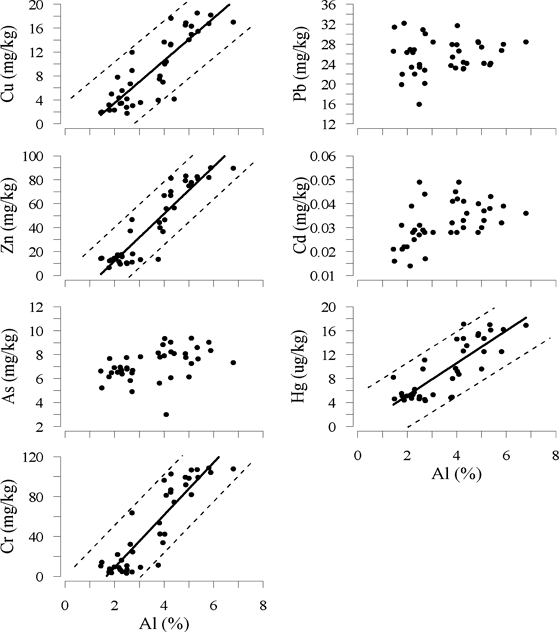
Linear regression showing background values for some heavy metals based on their correlation with Al. Dotted lines represent the upper and lower of 95% confidential intervals.

Calculated baseline concentrations (mg/kg) based on linear regression equation and cumulative frequency curve in the sediments of study area
누적빈도곡선에 의한 추정은 인위적 오염도가 크지 않은 해역에서 최소한의 오염을 지화학적 기저농도로 인식하는 방법으로 보존성금속과의 상관성이 낮은 지역적 특성이 강조된 금속 즉, 본 연구의 Pb, As, Cd의 경우에도 배경농도의 추산이 가능하다(Matschullat et al.[2000]; Teng et al.[2009]). 배경농도 추정은 누적도수의 변칙구간을 통해 배경농도와 변칙농도를 구분 짓고 변곡점 이하의 농도구간을 이용하여 산정하는데, 연구지역의 경우 모든 금속이 변곡점 없이 직선에 가까운 형태로(R2>0.9, p<0.05) 변칙농도는 존재하지 않는 것으로 간주할 수 있다(Fig. 7).
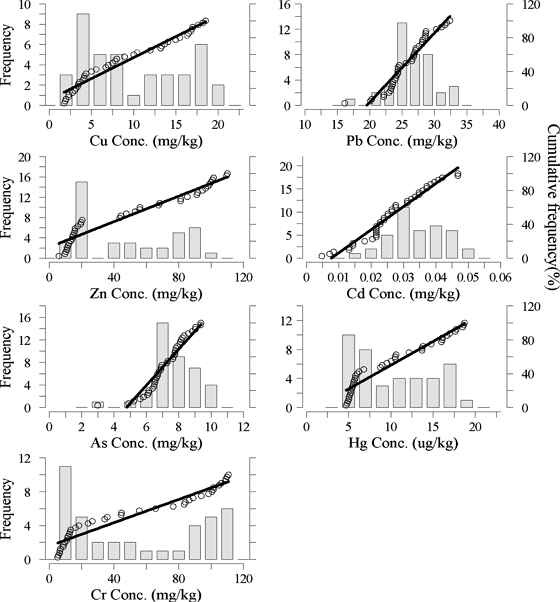
The frequency (bar) and cumulative frequency curve of some heavy metals. Linear regressions were performed on cumulative frequency with p<0.05 and R2>0.9.
위 두 방법에 적용된 시료는 Kolmogorov-Smirnov 검정을 통해 정규분포를 확인하였으며(2-tailed p>0.05), 추산된 각 금속의 배경 농도는 Table 2에 요약하였다. 표에 제시된 퇴적물의 배경농도는 Lim et al.[2007], Cho and Cho[2015] 및 Woo et al.[2019]의 사례연구에 나타난 것처럼 해당 퇴적환경 고유의 특성을 반영한다. 연구지역의 Pb 및 As는 타 지역과 비슷하였으나 Cd는 Woo et al.[2019] 연구와 47% 이상의 큰 차이가 특징적이다. 그 외 Cu, Zn, Cr, Hg는 비교된 지역과 10~20% 범위의 차이를 보였다.
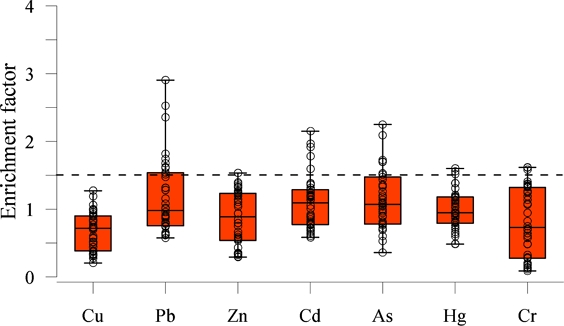
산출된 배경농도를 바탕으로 전체 퇴적물의 중금속 농축비를 구한 결과를 Fig. 8에 제시하였다. 농축비는 보존성원소에 대한 시료의 원소비를 배경농도의 원소비와 비교한 것으로서 일반적으로 그 비가 1.5를 초과하는 경우 오염으로 간주한다(Zhang et al.[2002]). 그림에 나타낸 바와 같이 Cu, Zn, Cr 및 Hg의 농축비는 1.5를 기준으로 보면 전반적으로 배경농도 이하의 낮은 분포를 보인다. 한편, Pb, Cd 및 As 농축비는 시료 전체의 평균은 1 내외로 낮지만 공간적으로 Pb는 최대 2.9, Cd 및 As는 최대 2.2로서 국지적인 농축이 확인되며, 이들 중금속의 농축은 주로 조립성분이 포함된 3.0Ø 이하의 일부 시료에 해당된다. 가장 많은 정점들에서 배경농도를 초과하는 Pb는 조립 퇴적물에 풍부한 탄산염과 함께 장석(K-feldspar)과의 밀접한 관련성에 의한 것으로 판단된다.
4. 결 론
신안 도서해역의 40개 표층퇴적물에서 입도와 유기물 및 중금속(Al, Fe, Mn, Li, Cu, Pb, Zn, Co, Cr, Hg) 함량을 분석하였다. 퇴적물의 입도는 -0.37~6.65Ø 범위로 서쪽 외해와 동쪽 육지방향으로 각각 모래와 니질이 우세한 퇴적상의 구분이 뚜렷하였으며, 주로 남서방향의 조류가 도서에서 멀어질수록 보다 강하게 흐르는 영향을 반영하였다. TOC의 함량은 평균 0.45%(0.07~1.18%)로 육지에 연한 퇴적물에 비해 매우 낮았으며, 공간적으로는 퇴적물의 입도와 밀접한 관련성(R2=0.70, p<0.01)을 보였다.
중금속 함량은 주변 연안환경 퇴적물에서 보고된 값에 비해 전반적으로 낮았으며, 국내 해저퇴적물 주의기준(TEL)을 하회하였다. 공간적으로는 입도와 양호한 관련성을 보인 Cr, Zn, Cu, Li, Fe, Hg, Al 함량은 40%() 이상의 큰 변화를 나타낸 반면 Pb, As, Cd는 13~27% 범위로 그 변화가 비교적 작았다. 그러한 차이는 조립 퇴적물에 포함된 광물의 조성과 비율이 금속에 따라 상이한 영향을 미친 결과로 해석되었다. 중금속 농축의 흔적을 탐색하기 위하여 연구지역의 배경농도를 선형회귀분석과 누적빈도곡선의 조합으로 추산하였으며, 그 결과를 타 지역 사례연구와 비교하여 배경농도의 차이가 퇴적환경 고유의 특성에 의한 것임을 인식하였다. 추산된 배경농도를 기준으로 살펴 본 연구지역의 중금속 농축은 전반적으로 오염수준 이하를 유지한 가운데 Pb, Cd 및 As는 시료 일부에서 약간의 국지적 농축이 확인되었다.
Acknowledgments
본 연구지역의 현장조사 및 시료채취에 도움을 준 ㈜해양수산자원연구소 연구원들과 논문의 심사를 통해 건설적인 제안을 해주신 심사위원께 감사드립니다.
References
-
Billon, G., Ouddane, B., Recourt, P. and Boughriet, A., 2002, Depth Variability and some Geochemical Characteristics of Fe, Mn, Ca, Mg, Sr, S, P, Cd and Zn in Anoxic Sediments from Authie Bay (Northern Frace), Estuar. Coast. and Shelf Sci., 55(2), 167-181.
[https://doi.org/10.1006/ecss.2001.0894]

-
Chang, J.H., Ryu, S.O. and Jo, Y.J., 2007, Long-term Variation of Tidal-flat Sediments in Gomso Bay, West Coast of Korea, J. Kor Environ Sci Soc., 28(3), 357-366.
[https://doi.org/10.5467/JKESS.2007.28.3.357]

- Cho, Y.G., Lee, C.B. and Choi, M.S., 1994, Characteristics of Heavy Metal Distribution in Surface Sediments from the South Sea of Korea, J. Korean Soc. Oceanogr., 29(4), 338-356.
- Cho, Y.G. and Park, K.Y., 1998, Heavy Metals in Surface Sediments of the Youngsan Estuary, West Coast of Korea, J. Environ. Sci., 7(4), 549-558.
- Cho, Y.G., Lee, C.B. and Koh, C.H., 2000, Heavy Metals in Surface Sediments from Kwangyang Bay South Coast of Korea, J. Kor. Soc. Oceanogr., 5(2), 131-140.
-
Cho, H.C. and Cho, Y.G., 2015, Heavy Metals in Surface Sediments from Doam Bay, Southwestern Coast of Korea, J. Kor. Soc. Oceanogr., 20(4), 159-168.
[https://doi.org/10.7850/jkso.2015.20.4.159]

- Cho, H.C., 2021, Background Concentration of Heavy Metals in Sediments of the Western and Southern Coast of Korea, Ph. D. Thesis, Mokpo National Univ., Korea.
-
Choi, M.K., Lee, I.S., Kim H.C. and Hwang, D.W., 2015, Distribution and Contamination Status of Trace Metals in Surface Sediments of Shellfish Farming Areas in Yeoja and Gangjin Bays, Korea. J. Kor. Fish. Soc., 48(5), 789-797.
[https://doi.org/10.5657/KFAS.2015.0789]

-
Folk, R.L. and Ward, W.C., 1957, Brazos river bar; A Study in the Significance of Grain Size Parameter, J. Sed. Petrol., 27(1), 3-26.
[https://doi.org/10.1306/74D70646-2B21-11D7-8648000102C1865D]

-
Ganeshram, R.S., Calvert, S.E., Pedersen, T.F. and Cowie, G.L., 1999, Factors Controlling the Burial of Organic Carbon in Laminated and Bioturbated Sediments off NW Mexico: implications for hydrocarbon preservation, Geochim. Cosmochim. Acta, 63(11-12), 1723-1734.
[https://doi.org/10.1016/S0016-7037(99)00073-3]

-
Horowitz, A.J., 1991, A Primer on Sediment-Trace Element Chemistry. Lewis Publishers, INC., 136.
[https://doi.org/10.3133/ofr9176]

- Hyun, S.M., Lee, T.H., Choi, J.S., Choi, D.L. and Woo, H.J., 2003, Geochemical Characteristics and Heavy Metal Pollutions in the Surface Sediments of Gwangyang and Yeosu Bay, South Coast of Korea, J. Kor. Soc. Oceanogr., 8(4), 380-391.
-
Hwang, D.W., Ryu, S.O., Kim, S.G., Choi, O.I.. Kim, S.S. and Koh, B.S., 2010, Geochemical Characteristics of Intertidal Surface Sediments along the Southwestern Coast of Korea, J. Kor. Fish. Soc., 43(2), 146-158.
[https://doi.org/10.5657/kfas.2010.43.2.146]

-
Hwang, D.W. and Kim, S.G., 2011, Evaluation of Heavy Metal Contamination in Intertidal Surface Sediments of Coastal Islands in the Western Part of Jeollanam Province Using Geochemical Assessment Techniques, J. Kor. Fish. Soc., 44(6), 772-784.
[https://doi.org/10.5657/KFAS.2011.0772]

-
Hwang, D.W., Park, S.E., Kim, P.J., Koh, B.S. and Choi, H.G., 2011, Assessment of the Pollution Levels of Organic Matter and Metallic Elements in the Intertidal Surface Sediments of Aphae Island, J. Kor. Fish. Soc., 44(6), 759-771.
[https://doi.org/10.5657/KFAS.2011.0759]

-
Hwang, D.W., Lee, I.S., Choi, M.K., Kim, S.Y. and Choi, H.G., 2013a, Evaluation of Organic Matter and Trace Metal Contamination in Surface Sediments around the Geum River Estuary using Sediment Quality Guidelines, J. Kor. Fish. Soc., 46(6), 930-940.
[https://doi.org/10.5657/KFAS.2013.0930]

-
Hwang, D.W., Kim, P.J., Jung, R.H. and Yoon, S.P., 2013b, Distributions of Organic Matter and Trace Metals in Intertidal Surface Sediment from the Mokpo-Haenam Coast, J. Kor. Fish. Soc., 46(4), 454-466.
[https://doi.org/10.5657/KFAS.2013.0454]

-
Hwang, D.W., Hwang, H.J., Lee, G.R., Kim, S.Y., Park, S.H. and Yoon, S.P., 2021, Organic Matter and Heavy Metals Pollution Assessment of Surface Sediment from a Fish Farming Area in Tongyoung-Geoje Coast of Korea, Kor. Soc. Mar. Environ. Saf., 27(4), 510-520.
[https://doi.org/10.7837/kosomes.2021.27.4.510]

- Ingram, R.L., 1971, Sieve Analysis. In: Procedures in Sedimentary Petrology, edited by Carver, R.E., Wiley-Inter Science, New York, 49-67.
- Jeon, S.B., Kim, P.J., Kim, S.S., Ju, J.S., Lee, Y.H., Chang, D.S., Lee, J.U. and Park, S.Y., 2012, Characteristics of Spatial Distribution of Geochemical Components in the Surface Sediments of the Deukryang Bay, J. of the Kor. Soc. Environ. Analysis, 15(3), 203-214.
-
Jeon, S.G. and Cho, Y.G., 2002, Some Heavy Metal Concentration of Surface Sediments from the Southwestern Coast of Korea, J. of the Environ. Sci., 11(12), 1299-1305.
[https://doi.org/10.5322/JES.2002.11.12.1299]

- Joe, D.J., Choi, M.S. and Kim, C.K., 2018, Distribution of Total Mercury in Korean Coastal Sediments, J. Kor. Soc. Oceanogr., 23(2), 76-90.
- KHOA(Korea Hydrographic and Oceanographic Agency), http://www.khoa.go.kr/oceangrid/gis/category/observe/observeSearch.do?type=EYS#none, , 2019.
-
Kitano, Y., Sakata, M. and Matsumoto, E., 1980. Partitioning of Heavy Metals (Pollutants) into Mineral and Organic Fractions in a Sediment Core from Tokyo Bay (Japan). Geochim. Cosmochim. Acta, 44(9), 1279-1285.
[https://doi.org/10.1016/0016-7037(80)90088-5]

-
Klamer, J.C., Hegeman, W.J.M. and Smedes, F., 1990, Comparison of Grain Size Correction Procedures for Organic Micropollutants and Heavy Metals in Marine Sediments. Hydrobiologia, 208(3), 213-220.
[https://doi.org/10.1007/BF00007786]

-
Lee, G.R., Hwang, D.W., Hwang, H.J., Park, J.H., Kim, H.C. and Kwon, J.N., 2017, Distribution and Pollution Status of Organic Matter and Heavy Metals in Surface Sediment Around Goseong Bay, a Shellfish Farming Area, Korea, Kor. Soc. Mar. Environ. Saf., 23(6), 699-709.
[https://doi.org/10.7837/kosomes.2017.23.6.699]

-
Lee, G.R., Hwang, H.J., Kim, J.B. and Hwang, D.W., 2020, Pollution Status of Surface Sediment in Jinju Bay, a Spraying Shellfish Farming Area, Korea, Kor. Soc. Mar. Environ. Saf., 26(4), 392-402.
[https://doi.org/10.7837/kosomes.2020.26.4.392]

-
Lim, D.I., Choi, J.Y., Jung, H.S., Choi, H.W. and Kim, Y.O., 2007, Natural Background Level Analysis of Heavy Metal Concentration in Korean Coastal Sediments, Ocean & Polar Res., 29(4), 379-389.
[https://doi.org/10.4217/OPR.2007.29.4.379]

-
Luoma, S., 1990, Processes Affecting Metal Concentrations in Estuarine and Coastal Marine Sediment. In; Heavy Metals in the Marine Environment, edited by Fumess R.W. and P.S., Rainbow, CRC Press Inc., 51-66.
[https://doi.org/10.1201/9781351073158-4]

-
Martin, J.M. and Whitfield, M., 1983, The Significance of the River Input of Chemical Elements to the Ocean. In: Trace Metals in Sea Water, edited by Wong, C.S., E.A. Boyle, K.W. Bruland, J.D. Burton and E.D. Goldberg, New York: Plenum, 265-296.
[https://doi.org/10.1007/978-1-4757-6864-0_16]

-
Matschullat, J., Ottenstein, R. and Reimann, C., 2000, Geochemical Background-Can we calculate it?, Environ. Geol., 39(9), 990-1000.
[https://doi.org/10.1007/s002549900084]

-
Mayer, L.M., 1994, Relationships between Mineral Surfaces and Organic Carbon Concentrations in Soils and Sediments, Chem. Geol., 114(3-4), 347-363.
[https://doi.org/10.1016/0009-2541(94)90063-9]

-
Newman, B.K. and Watling, R.J., 2007, Definition of Baseline Metal Concentration for Assessing Metal Enrichment of Sediment from the South-Eastern Cape Coastline of South Africa. Water S.A, 33(5), 675-691.
[https://doi.org/10.4314/wsa.v33i5.184089]

-
Pedersen, T.F. and Price, N.B., 1982. The Geochemistry of Manganese Carbonate in Panama Basin Sediments. Geochim. Cosmochim. Acta, 46(1), 59-68.
[https://doi.org/10.1016/0016-7037(82)90290-3]

- Ryu, S.O., Chang, J.H., Lee, H.J., Jo, Y.J. and Choi, O.I., 2009, Spatial and Temporal Variation of Surface Sediments by Tidal Environment Changes: Muan Bay, West Coast of Korea, J. Kor. Soc. Oceanogr., 14(1), 10-21.
-
Salomons, W. and Forstner, U., 1984, Metals in the Hydrocycle. Springer-Verlag, Berlin Heidelberg, 349.
[https://doi.org/10.1007/978-3-642-69325-0]

- Shinangun, 2021, Shinan Statistical Year Book, Shinangun Report.
-
Siegel, F.R., 1995, Environmental Geochemistry in Development Planning: An Example from the Nile Delta, Egypt, Geochem. Exploration, 55(1-3), 265-273.
[https://doi.org/10.1016/0375-6742(94)00071-9]

-
Sly, P.G., Thomas, R.L. and Pelletier, B.R., 1983, Interpretation of Moment Measures Derived from Water-Lain Sediment, Sedimentology, 30(2), 219-233.
[https://doi.org/10.1111/j.1365-3091.1983.tb00666.x]

-
Song, Y.H., Choi, M.S. and Ahn, Y.W., 2011, Trace Metals in Chun-su Bay Sediments, J. Korean Soc. Oceanogr., 16(4), 169-179.
[https://doi.org/10.7850/jkso.2011.16.4.169]

-
Song, Y.H., Jang, D.J., Choi, M.S. and Lee, J.Y., 2014, Regional Background Concentrations of Hevy Metal (Cr, Co, Ni, Cu, Zn, Pb) in Coastal Sediments of the South Sea of Korea, Sci. Total Environ., 482-483(1), 80-91.
[https://doi.org/10.1016/j.scitotenv.2014.02.068]

-
Song, Y.H. and Choi, M.S., 2017, Assessment of Heavy Metal Contamination in Sediments along the Coast of South Korea using Cs-normalized Background Concentrations, Mar. Pollut. Bull., 117(1-2), 532-537.
[https://doi.org/10.1016/j.marpolbul.2017.02.019]

-
Summer, J.K., Wade, T.L., Engle, V.D. and Malaeb, Z.A., 1996, Normalization of Metal Concentration in Estuarine Sediments from the Gulf of Mexico. Estuaries, 19(3), 581-594.
[https://doi.org/10.2307/1352519]

-
Teng, Y., Ni, S., Wang, J. and Niu, L., 2009, Geochemical Baseline of Trace Elements in the Sediment in Dexing Area, South China, Environ. Geol., 57(7), 1649-1660.
[https://doi.org/10.1007/s00254-008-1446-2]

-
Turekian K.K. and Wedepohl, K.H., 1961, Distribution of the Elements in Some Major Units of the Earth’s Crust, Geol. Soc. Am. Mull., 72(2), 175-192.
[https://doi.org/10.1130/0016-7606(1961)72[175:DOTEIS]2.0.CO;2]

-
Wang, S., Jia, Y., Wang, S., Wang, X., Wang, H., Zhao, Z. and Liu, B., 2010, Fractionation of Heavy Metals in Shallow Marine Sediments from Jinzhou Bay, China, J. of Environ. Sci. 22(1), 23-31.
[https://doi.org/10.1016/S1001-0742(09)60070-X]

- Woo, J.S., Lee, H.J., Park, J.K., Park, K.G., Cho, D.J., Jang, D.J., Park, S.J., Choi, M.S. and Yoo, J.K., 2019, Background Concentration and Contamination Assessment of Heavy Metals in Korean Coastal Sediments. J. Korean Soc. Oceanogr., 24(1), 64-78.
- Youn, S.T., Koh, Y.K. and Ryu, S.O., 1999, Distribution Characteristics of Surface Sediments and Metal Elements in Hampyong Bay, the Southwestern Coast of Korea, J. Kor. Environ. Sci. Soc., 8(6), 677-684.
-
Zhang, J., Huang, W.W. and Martin, J.M., 1988. Trace Metals Distribution in Huanghe(Yellow River) Estuarine Sediments. Estuar. Cost. and Shelf Sci., 26(5), 499-516.
[https://doi.org/10.1016/0272-7714(88)90003-0]

-
Zhang, C., Wang, L., Li, G., Dong, S., Yang, J. and Wang, X., 2002, Grain Size Effect on Multi-Element Concentrations in Sediments from the Intertidal Flats of Bohai Bay, China, Appl. Geochem., 17(1), 59-68.
[https://doi.org/10.1016/S0883-2927(01)00079-8]


