Simulation and Evaluation of Sea Surface Observations Using a Microwave Doppler Radar
Abstract
A simulation is applied to evaluate sea surface observations such as wave heights and surface currents by using a microwave Doppler radar. It is reported that the microwave irradiation width on the sea surface and Fourier transform time taken to sample data for frequency analysis affect Doppler spectra. To investigate the influences by these parameters, Doppler spectra are simulated with various numerical sea surface waves with currents. From the results, in the case of the microwave irradiation width is five times smaller than the wavelength of the sea surface wave, and the Fourier transform time is also five times shorter than the period of the sea surface wave, there is a possibility to measure wave heights accurately with a Doppler radar. In addition, relative surface currents can be estimated by analysis of long Fourier transform time. The simulation results showed the appropriate observing conditions with a microwave Doppler radar.
초록
해면으로부터의 마이크로웨이브 후방산란 시뮬레이션을 이용하여 마이크로웨이브 도플러 레이더에 의한 파고와 해면 흐름 관측법을 평가하였다. 해면으로부터 후방산란하는 마이크로웨이브의 도플러 스펙트럼은 마이크로웨이브 해면 조사폭과 스펙트럼 해석 시간폭의 영향을 받는다. 본 연구에서는 마이크로웨이브 해면 조사폭과 스펙트럼 해석 시간폭의 영향을 조사하기 위하여, 다양한 파랑과 해면 흐름 조건의 수치 해면 생성과 마이크로웨이브 후방산란 시뮬레이션을 통하여 도플러 스펙트럼을 구하였다. 결과에 의하면 마이크로웨이브 해면 조사폭을 파장의 1/5이하, 스펙트럼 해석 시간폭을 파주기의 1/5이하로 설정하면, 충분한 정도의 파고계측이 가능하다. 또한, 파주기에 비해서 충분히 긴 스펙트럼 해석 시간폭을 설정하면 해면 흐름의 상대유속 계측이 가능하다. 시뮬레이션을 이용하여 마이크로웨이브 도플러 레이더에 의한 해면관측의 적절한 계측방법을 찾을 수 있다.
Keywords:
Sea Surface Observation, Doppler Radar, Microwave Backscattering, Numerical Simulation키워드:
해면관측, 도플러 레이더, 마이크로웨이브 후방산란, 수치 시뮬레이션1. INTRODUCTION
Radar remote sensing is an effective method to observe the sea surface. A microwave Doppler radar is used to estimate sea surface conditions by measuring Doppler shifts of backscattered microwaves. Simulations for obtaining Doppler spectra can be used to evaluate sea surface observations. For example, Yoshida and Rheem [2012] have developed a simulation of microwave backscattering from three-dimensional numerical sea surface. They had developed the simulation technique in the time domain to compute time series of the microwave backscattering from the numerical sea surface moving in time. The radar works in X band. The computational grids are smaller than the transmit microwave to produce accurate microwave scattering on the sea surface. The Doppler spectra are calculated by fast Fourier transform (FFT) of time series of backscattered signals. Physical optics (PO) approximation is used in the simulation. The simulations were conducted under the same condition with experiment in the water tank. Incident angle dependence (the relation between incident angle and backscattering coefficients) obtained by the simulation is compared to those of the experiment. Also, backscattering coefficients and Doppler shifts for wind waves and regular waves are compared. The simulation results were in good agreement with the experiment.
In this paper, as an application of the simulation technique, observing algorithms for sea surface observations by a Doppler radar are evaluated. According to Rheem [2008], the relations between microwave irradiation width and wavelengths of ocean waves affect Doppler spectra obtained by a Doppler radar. It is reported that ocean waves that are smaller than microwave irradiation width (MIW) cannot be obtained in radar signals. In other words, Doppler shifts caused by orbital motions of the sea surface waves are not shown clearly in Doppler spectra. This is called the effect of microwave irradiation width on Doppler spectra. Yoshida and Rheem [2012] showed the simulation results by varying microwave irradiation width. In addition, Fourier transform time taken to sample data for frequency analysis also has the same effect as the one of the microwave irradiation width. Thus, Fourier transform time is remarked in this paper. Furthermore, sea surface current is added to the numerical sea surface waves to retrace the current data by the analysis. In order to evaluate observations, Doppler spectra are simulated with various numerical sea surfaces. From the simulation results, we attempt to clarify the appropriate observation conditions for measuring wave heights and sea surface currents using a microwave Doppler radar.
2. SIMULATION METHOD AND NUMERICAL SEA SURFACE
The method for simulating microwave backscattering from the ocean surface is referred to Yoshida and Rheem [2012]. We use the same method to obtain radar signals including Doppler shifts. In order to simulate scattering electric fields, physical optics approximation is used. The calculation area is divided into the triangular computational grids. The scale of them is set as 1/10 of the radar wavelength to reproduce Bragg scattering. The discrete scattering electric field is expressed as follows. It is assumed that the antenna is in far field from the ocean surface.
| (1) |
| (2) |
where Es is the scattering electric field, J is the surface electric current, N' is the number of computational grids, rn is the position of the grids, r is the position of the antenna, An is the area of grids is, and ωe, ke are the angular frequency and wave number of microwave, respectively, μ is the magnetic permeability, n is the normal vector of grids, and Hi is the incident magnetic field. Polarization is vertical. The incident magnetic field can be expressed as follows.
| (3) |
where η is the dielectric constant.
The power density S' of an antenna is expressed as following equation.
| (4) |
where R is the distance from the observation point to the scattering point, Pt is the input power, and G (βn) is the gain of an antenna. The gain is approximately shown as the following equation:
| (5) |
where G0 is the maximum gain, βn is the angle between look direction and antenna beam, and β1/2 is the half-power beam width.
Here, generating numerical sea surfaces is described as follows. The numerical sea surface is composed of a long regular wave and small irregular waves. The long regular wave as a gravity wave is expressed as a trochoidal wave in order to show orbital motions clearly. When the wave propagates toward the x-axis, it is expressed as:
| (6) |
| (7) |
where z is the elevation of the wave, (x,z) are the positions of the water particles (x0, z0) is the mean position of the water particles with mean water level z0=0, and A, k, ω is the amplitude, wave number, angular frequency of the wave, respectively. For deep-water waves, a dispersion relationship between the frequencies and the wave numbers is as following equation.
| (8) |
where g is the gravitational constant. If the uniform surface current Uc is added linearly, the angular frequency is expressed as ω–kUc.
As described in Yoshida and Rheem [2012], the small irregular waves as capillary waves are summations of some regular waves with random phases by dividing the wave spectrum proposed by Mitsuyasu and Honda [1974]. It is given by:
| (9) |
where u* is the friction velocity of the wind, αs is the value relating to u*, and g* is the gravitational acceleration with regard to the surface tension.
The small irregular waves are the same scale as Bragg resonant waves to reproduce Bragg scattering. The irregular waves are added to the long regular wave. The dispersion relation for capillary waves is referred to Rheem et al. [2003] and is expresses as:
| (10) |
where Chi is the hyperbolic cosine integral and Shi is the hyperbolic sine integral. z0 is the roughness parameter, u0 is the surface current velocity, ur is the gradient drift current. The parameters for wind speed 6 m/s (at 0.3 m height) in the simulation are estimated by Mitsuyasu and Honda [1974] and Rheem [2003], these values are set as: z0= 3.22×10⁻⁵ m, u* = 0.265 m/s, u0= 0.219 m/s, ur = 0.0226 m/s, αs = 0.0057.
The details of creating irregular waves are as follows: the range of wavelength is 0.5 to 1.5 times as the wavelength of microwave, the number of spectral division is 50, and irregular sea surface is composed of five waves whose directions are at intervals of 10° (± 20°). 0° is toward to the x-axis.
3. NUMERICAL EVALUATION OF SEA SURFACE OBSERVATION
Here, an algorithm of sea surface observations with a microwave Doppler radar are evaluated by the simulation. The algorithm of wave height estimation is based on time changes of Doppler shifts. A problem of the algorithm for wave height estimation is reported by Rheem [2008] such that when the microwave irradiation width becomes large, the accuracy of the estimation decreases. It means that ocean waves that are smaller than microwave irradiation width cannot be measured by a Doppler radar. The measurements are influenced by the relation between the microwave irradiation width and wavelength of ocean wave. Also, Fourier transform time taken to sample data for frequency analysis has the similar effect. Therefore, backscattering microwaves are analyzed by short term FFT to obtain time change of Doppler spectra.
Now, we investigate how the microwave irradiation width and the Fourier transform time affect the time changes of Doppler signals. At first, overviews of the effects are explained. Next, Doppler spectra are simulated with various wave conditions. Finally, we discuss the appropriate observation parameters.
3.1 Relation between Doppler spectrum, microwave irradiation width and Fourier transform time
The effect of the microwave irradiation width (MIW) on Doppler spectra is classified into the following two patterns: (a) MIW > sea surface waves, (b) MIW < sea surface waves. As illustrated in Fig. 1(a), the Doppler shifts do not change as the sea surface because the backscattering microwave includes Doppler shifts, which are scattered from all points of the orbital motions of the regular wave. In Fig. 1(b), Doppler shifts caused by orbital motions of sea surface waves change in time with the sea surface wave. This condition is considerably suited for the wave height estimation by a Doppler radar.
The effect of Fourier transform time (ΔT) is also classified into the following two patterns: (a) ΔT > wave periods, (b) ΔT < wave periods. In Fig. 2(a), the changes of Doppler shifts cannot be measured. In Fig. 2(b), the changes of Doppler shifts can be measured. The effect of Fourier transform time is similar to the one of the microwave irradiation width.

The relation between microwave irradiation width (MIW) and wavelength. (a) MIW > Wavelength. (b) MIW < Wavelength.
3.2 Simulation condition
Doppler spectra are simulated from the sea surfaces that consist of the small wind waves and the long regular gravity wave. The wave directions of them are the same. The irregular wind waves are just added on the regular gravity wave for simplicity.
The simulation conditions are shown in Table 1, and the conditions of the numerical regular waves are shown in Table 2, where λ is the wavelength, T is the period and A is the amplitude of the long regular waves, respectively.
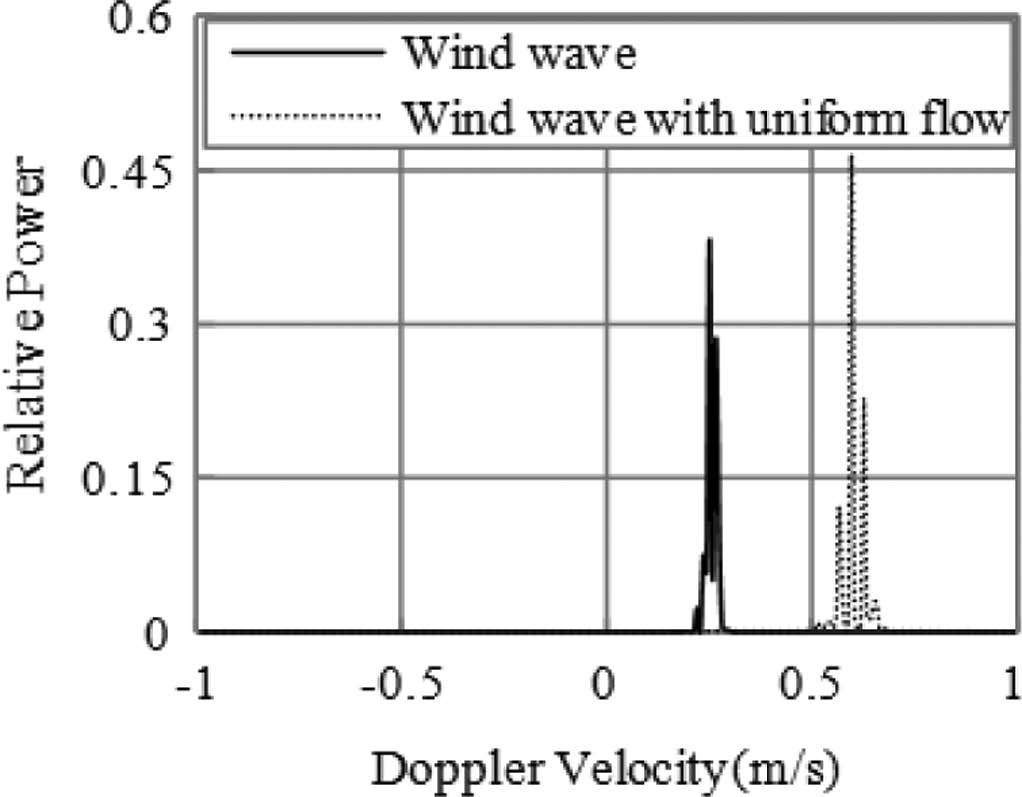
Fig. 3 shows the samples of Doppler spectra. x-axis is Doppler velocity and y-axis is relative power. The Doppler velocity is calculated by the following equation.
| (11) |
where Δf is the Doppler shift in frequency caused by moving ocean surfaces, f0 is the frequency of incident microwave, vr is the radial velocity of ocean surfaces toward to the antenna, and c is the light velocity.
The relative power shows each power divided by all powers of the spectrum. Doppler spectra are obtained by short term FFT from four different start times (0, T/4, T/2, and 3T/4).
As shown in Fig. 3(a), the Doppler spectra do not change periodically though the regular wave is moving in time, under the conditions that the microwave irradiation width is larger than the sea surface wavelength (Fig. 1(a)) and the Fourier transform time is longer than the period of the sea surface wave (Fig. 2(a)).
On the other hand, as shown in Fig. 3(b), the Doppler spectra change clearly in time in the case of the microwave irradiation width is smaller than the sea surface wavelength (Fig. 1(b)) and the Fourier transform time is shorter than the period of the sea surface wave (Fig. 2(b)).
Furthermore, in order to show the influence of sea surface currents in the simulation, Doppler spectra for only wind waves and wind waves with a uniform flow are shown in Fig. 4. When the uniform flow as the sea surface current is added to the wind wave, the Doppler spectrum is shifted with respect to the uniform flow. In this case, the velocity of the flow is 0.5 m/s, and the radial velocity (line-in-sight velocity) is approximately 0.35 m/s under the incident angle of 45°. The spectral shift in Fig. 4 corresponds to the radial velocity of the uniform flow.

The samples of the simulated Doppler spectra Tis the period of the regular wave. The four spectra are calculated by FFT at the intervals of T/4. (a) λ/MIW = 1, delta ΔT = 0.128 (b) λ/MIW=5, delta ΔT = 0.128 (c) schematic illustration of a sample of different start time for FFT.
3.3 Evaluation of time fluctuation in doppler shift
Time fluctuations of Doppler velocities are shown to examine the relation between microwave irradiation width and Doppler velocities. Short term FFT is conducted to simulated microwave backscattering to obtain Doppler shifts, then we plot the Doppler velocities that show the average values of each Doppler spectrum at different start time for FFT as shown in Fig. 3.
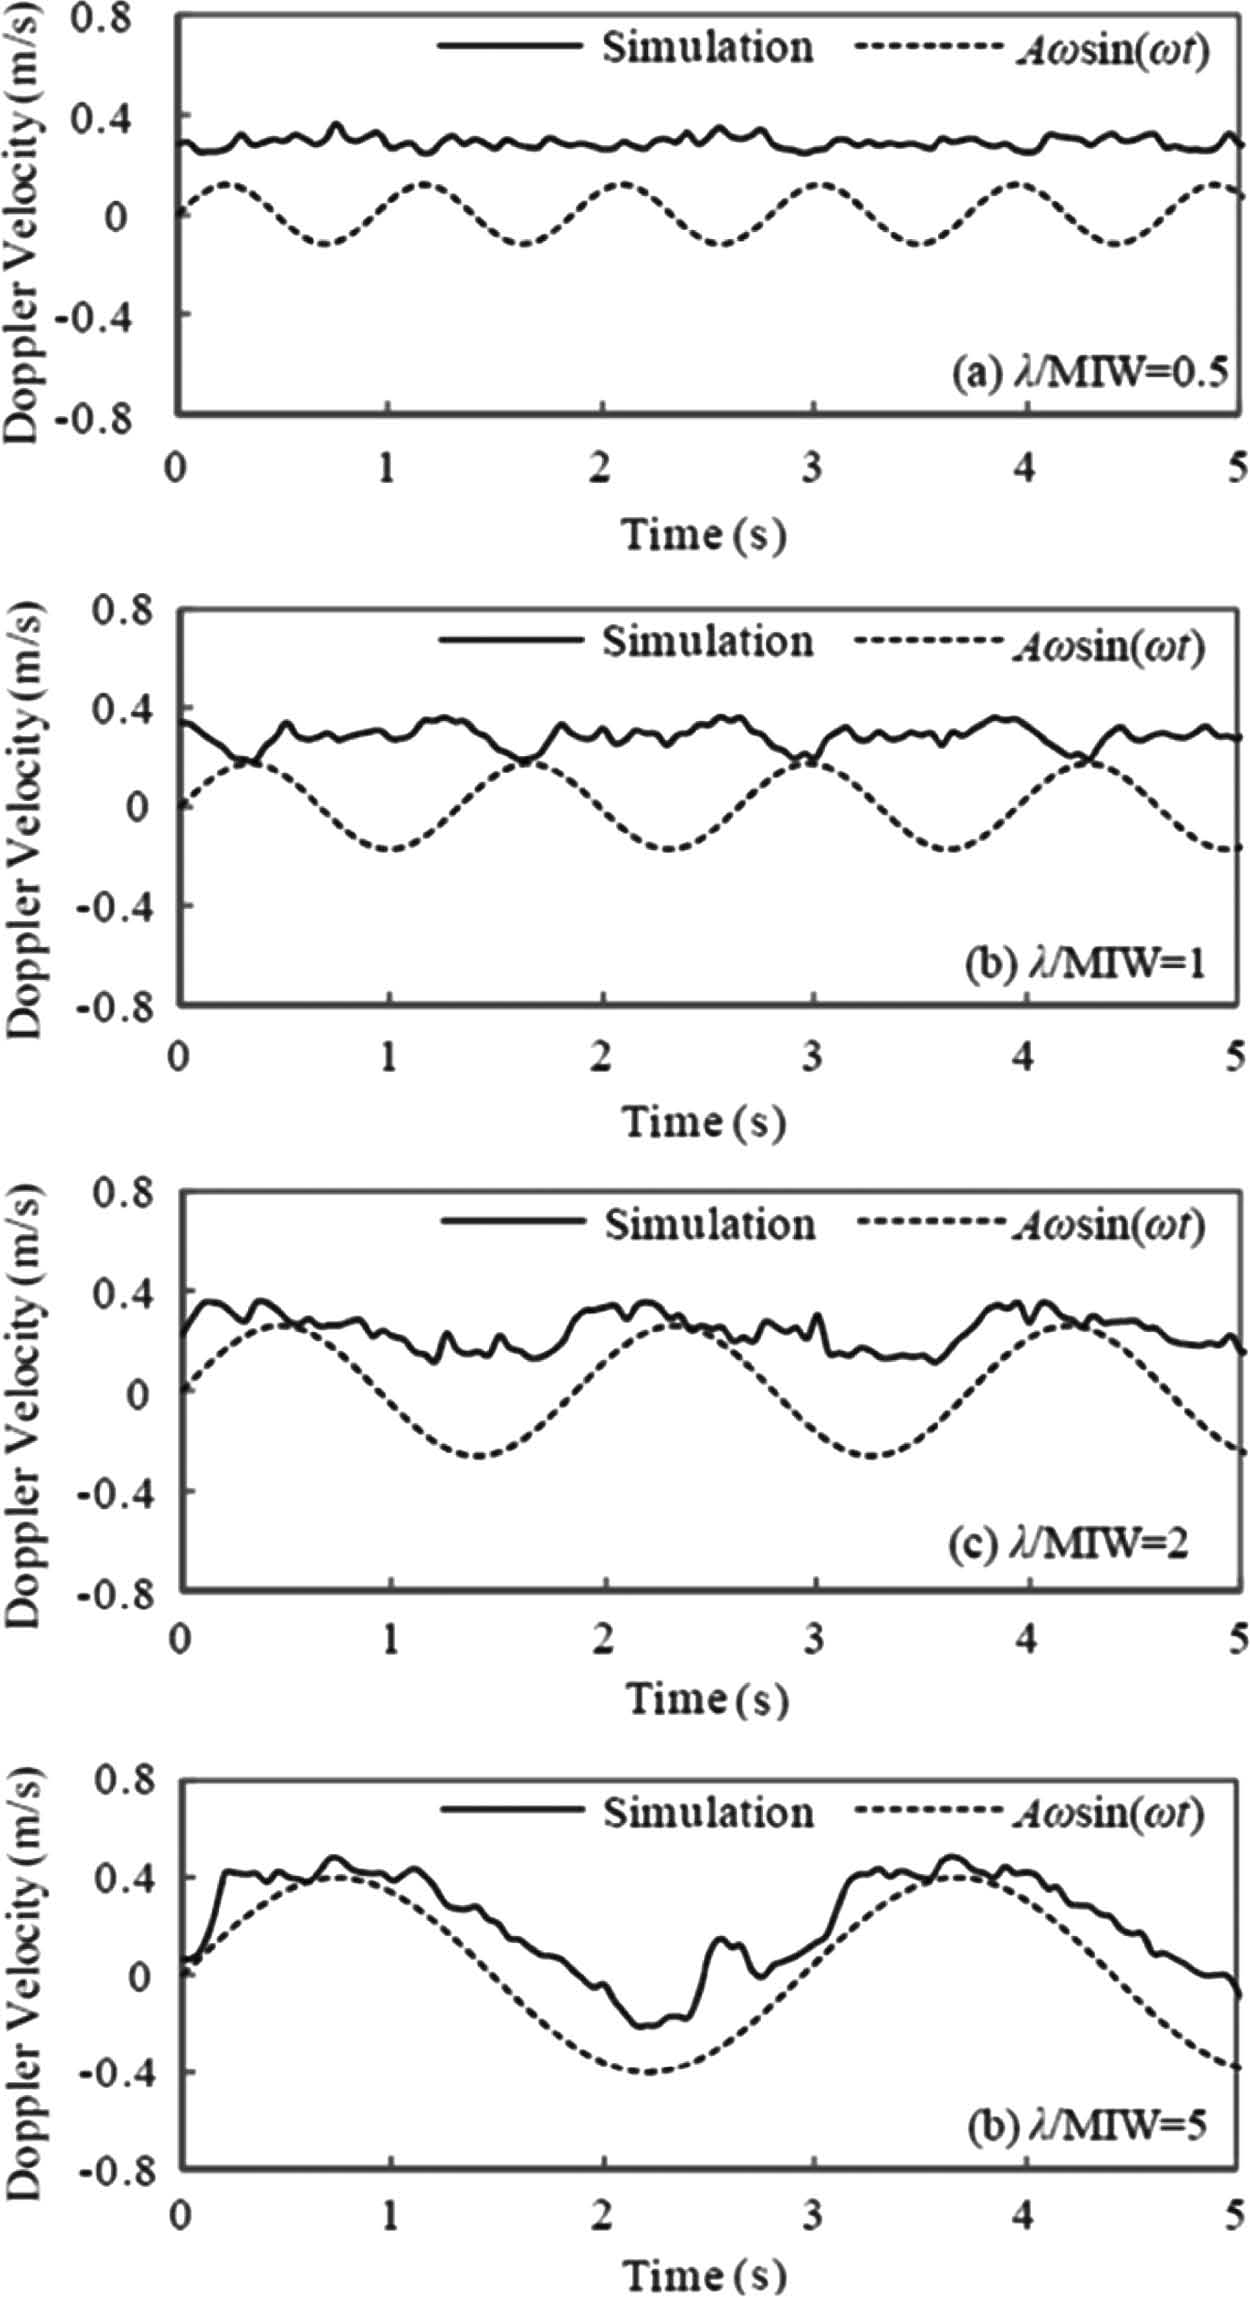
The simulations are cariied out with varying λ/MIW as a parameter from 0.5 to 5. Fig. 5 shows the results of time fluctuations of Doppler velocities. The Doppler spectra are calculated at intervals of 0.05 s and the Fourier transform time ΔT is set as 0.128 s. The dotted line in the figures shows the orbital motions of the regular waves (Aωsin(ωt)).
As shown in Fig. 5, the time fluctuations of Doppler velocities are not consistent with the orbital motions of the regular waves and the wind wave under the conditions of λ/MIW < 5. In such conditions, the changes of the Doppler velocities due to the orbital motions of the regular waves are not shown clearly in Doppler spectra. It is caused by the effect of microwave irradiation width on Doppler spectra. Thus, λ/MIW < 5 is not a suitable condition for wave height estimation by a Doppler radar. Whereas, in the case of λ/MIW = 5, the magnitude and the period of the time fluctuations of Doppler velocities are in good agreement with the orbital motions of the long regular waves.
According to Rheem [2007], if the magnitude and the period of Doppler velocities are consistent with orbital motions of regular waves, wave height can be estimated precisely. Consequently, the simulation results show that λ/MIW > 5 is required for wave height estimation by a Doppler radar.
3.3 Fourier transform time
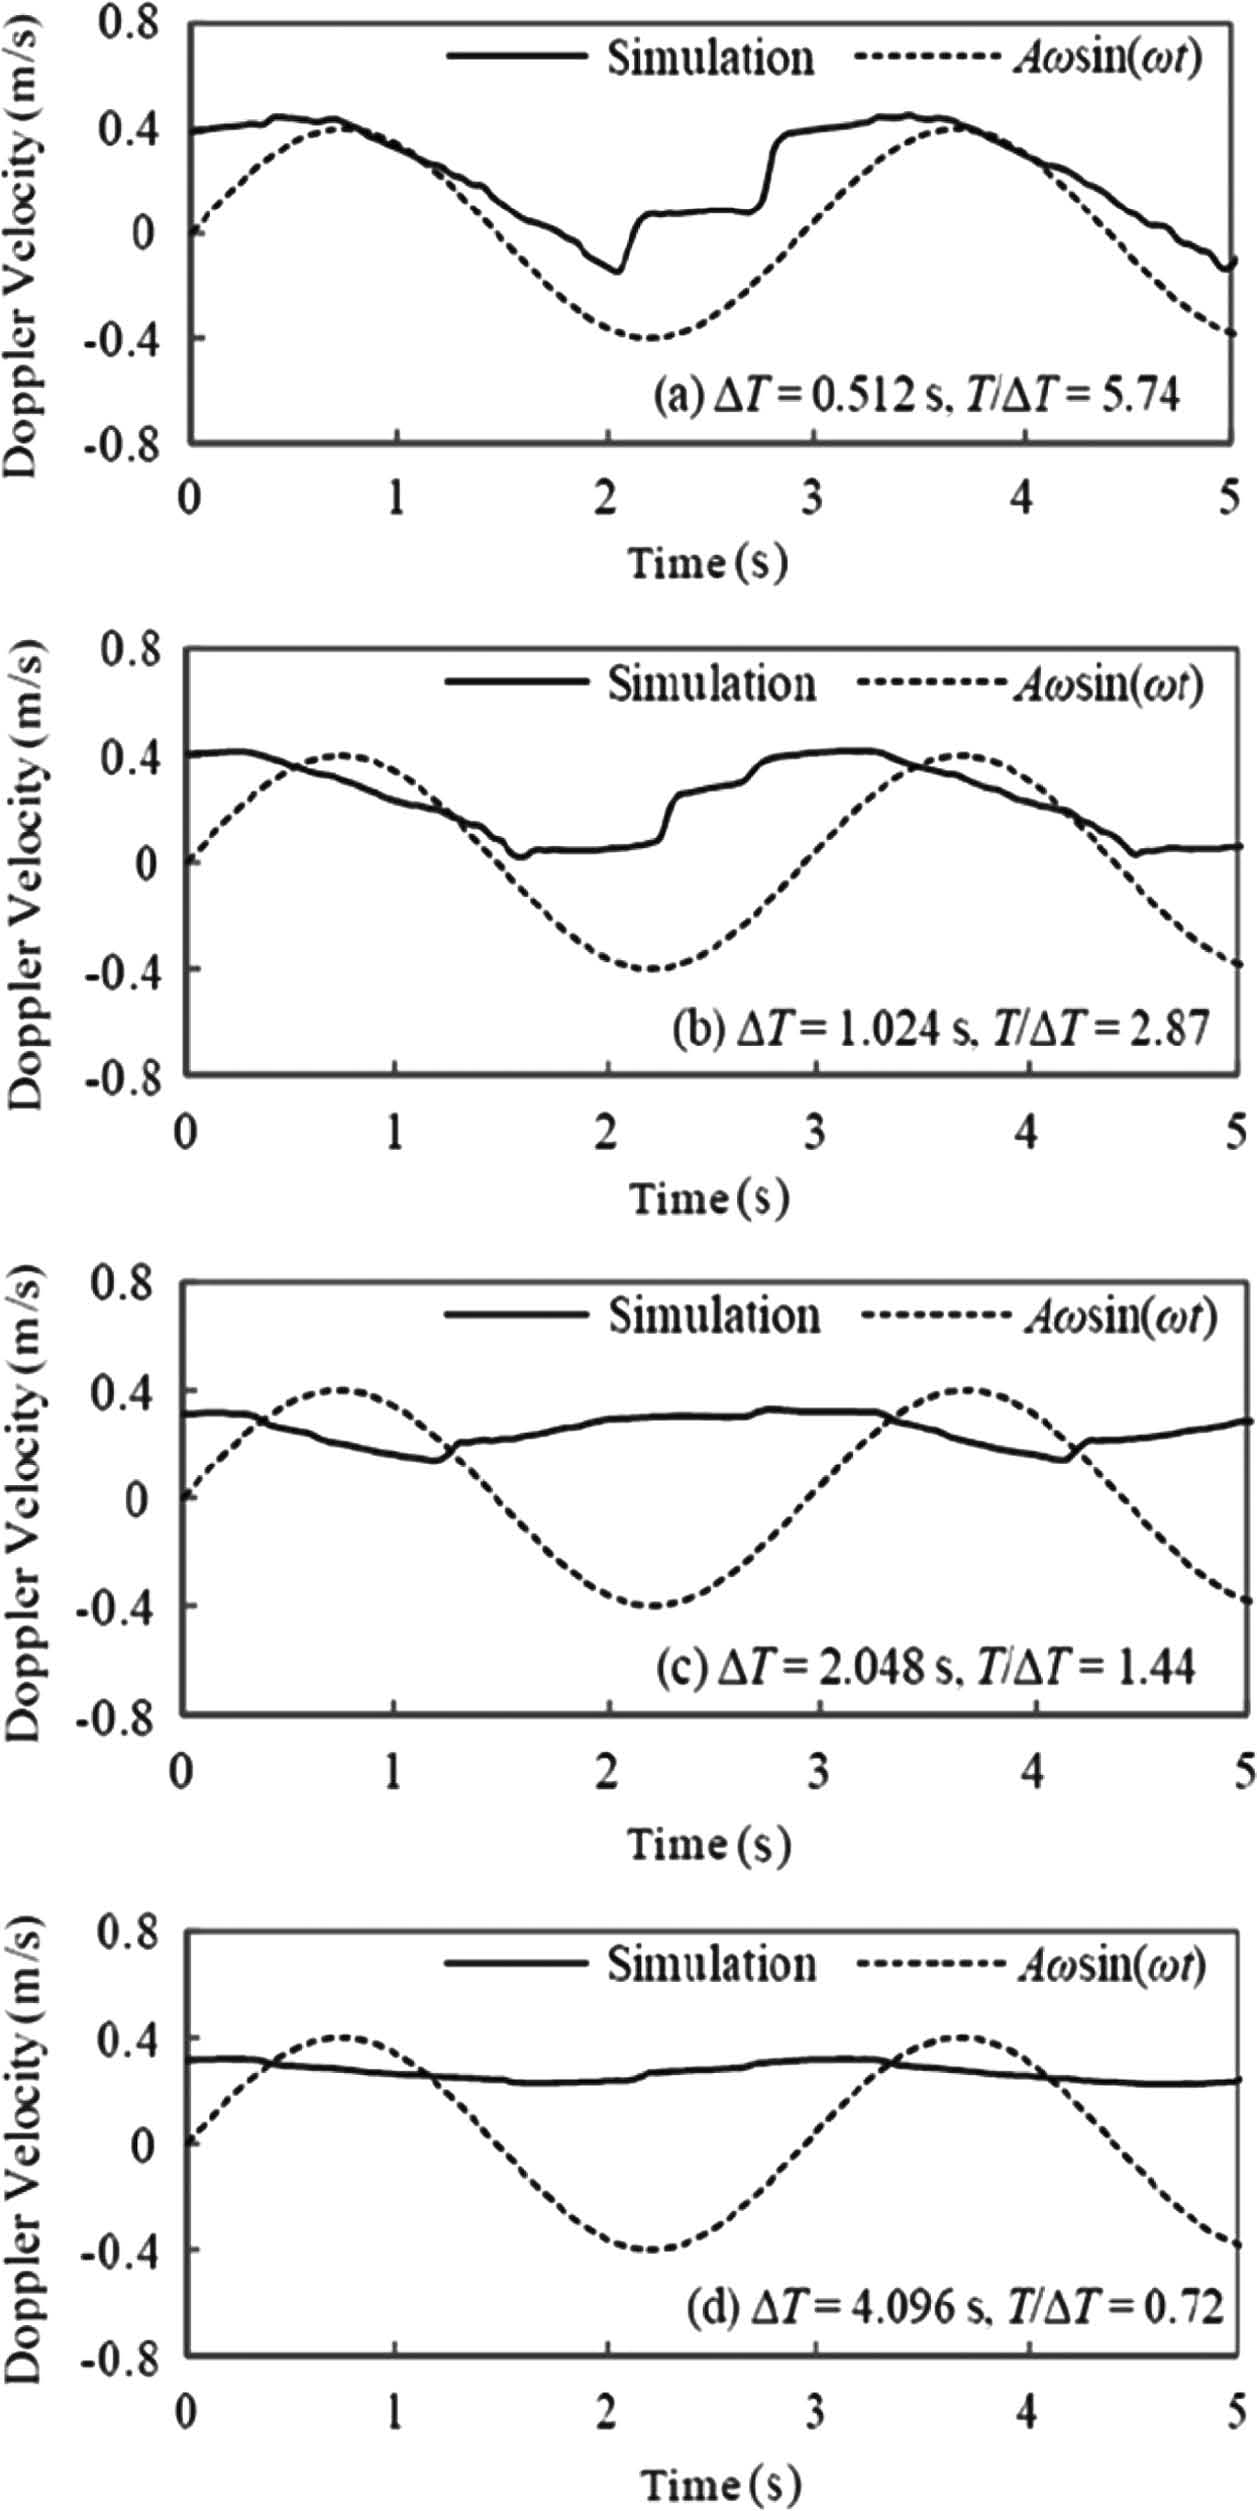
Time fluctuations of Doppler velocities are also related to Fourier transform time. The simulation is perfomed under the condition of λ/MIW=5 with various Fourier transform time ΔT = 0.256, 0.512, 1.024 and 2.048 s. The simulation results of time fluctuations of Doppler velocities are shown in Fig. 6. In Fig. 6(d), the fluctuations of the Doppler velocities are not consistent to the orbital motions of the regular waves and the wind wave. This is caused by the effect of Fourier transform time on Doppler spectra. While, in Fig. 6(a), the magnitude and the period of simulated the Doppler velocity changes relating to the orbital motions of the long regular waves. Therefore, wave height estimation by using a Doppler radar can be condcted under the condition that T/ΔT > 5. The effect of the Fourier transform time on Doppler spectra shown in the results is similar to that of the microwave irradiation width.
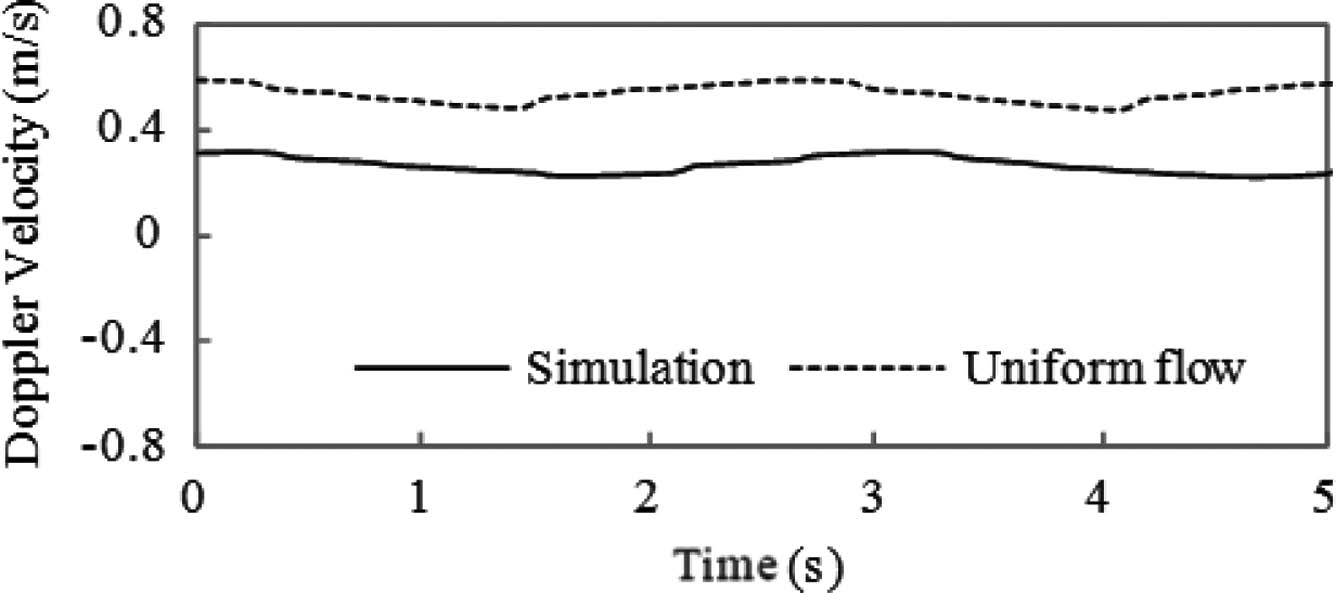
When the Fourier transform time is long comparing to the wave period T (Fig. 6(d)), the Doppler velocities are convergenced to the phase velocity of the Bragg resonant wave. This is the same result of the condition of a large microwave irradiation width as shown in Fig. 5(a). If the microwave irradiation width is large or the Fourier transform time is long, Doppler velocities show the phase velocity of a Bragg resonant wave. In addition, as shown in Fig. 7, if a uniform flow as a sea surface current is added to the condition of Fig. 6(d), the Doppler velocity shows the phase velocity of the Bragg resonant wave shifted by the uniform flow. The uniform flow is the same as shown in Fig. 4. The Doppler velocities with the uniform flow are shifted approximately 0.35 m/s that is nearly equal to the radial velocity of the current. Therefore, relative sea surface currents can be estimated from the time flctuation of Doppler velocities by analyzing long Fourier transform time though microwave irradiation width is set as small. The results show that it is possible to measure wave heights and relative sea surface currents using a microwave Doppler radar by altering analysis in raw signals.

Time fluctuation of simulated Doppler velocity with varying ΔT (Fourier transform time), λ/MIW (wavelength of the regular wave/microwave irradiation width) = 5 as a fixed parameter. The solid line shows the simulation. The dotted line shows the orbital motions of the regular wave.

Time fluctuations of the simulated Doppler velocities, ΔT (Fourier transform time) = 4.096 s and λ/MIW (wavelength of the regular wave/ microwave irradiation width) = 5. The solid line is the same as Fig. 6(d). The dotted line shows the Doppler velocities with the uniform flow, which is added as the surface current.
4. CONCLUSIONS
This paper describes numerical evaluation of sea surface observations by a microwave Doppler radar. Doppler spectra are obtained with varying microwave irradiation width and Fourier transform time. As the results, when microwave irradiation width is five times smaller than the wavelength of the sea surface wave, and the Fourier transform time is also five times shorter than the period of the sea surface wave, the time fluctuations of the Doppler velocities are in good agreement with the orbital motions of the long regular waves. This is an appropriate condition to measure wave heights precisely with a Doppler radar. The simulation results also suggest that wave heights and relative surface currents can be observed using a Doppler radar by analysis of different Fourier transform time. It means that a microwave Doppler radar with small microwave irradiation width for measuring wave height can be used to obtain surface currents by altering the analysis. It is useful to measure various ocean data by a microwave Doppler radar.
Reference
- Battan, L.J., (1993), Radar Meteorology, University of Chicago Press.
- Lamb, H., (1959), Hydrodynamics, Cambridge Univ. Press, Cambridge, p421-423.
-
Mitsuyasu, H., and Honda, T., (1974), “The high frequency spectrum of wind-generated waves”, Journal of the Oceanographical Society of Japan, 30, p185-198.
[https://doi.org/10.1007/BF02111070]

- Nathanson, F.E., (1991), Radar Design Principles, Signal Processing and the Environment, 2nd ed., McGraw-Hill.
-
Rheem, C.-K., Kobayashi, H., Yamanishi, K., and Suzuki, F., (2003), “Sea surface measurement by using microwave scatterometer part2 study on the relation between sea surface condition and microwave scattering”, Journal of the Japan Society of Naval Architects and Ocean Engineers, 194, p241-246.
[https://doi.org/10.2534/jjasnaoe1968.2003.194_241]

- Rheem, C.-K., (2007), “Water surface wave observation by using microwave Doppler radar in experimental basin”, Journal of the Japan Society of Naval Architects and Ocean Engineers, 6, p65-73.
- Rheem, C.-K., (2008), “Sea surface wave observation by using CW Doppler radar and effect of radar irradiation width”, Journal of the Japan Society of Naval Architects and Ocean Engineers, 8, p61-69.
- Silver, S., (1949), Microwave antenna theory and design, Peter Peregrinus Ltd., London, p144-168.
-
Wright, J.W., (1968), “A new model for sea clutter”, IEEE Trans., Antennas Propag., 16, p217-223.
[https://doi.org/10.1109/TAP.1968.1139147]

-
Yoshida, T., and Rheem, C-K., (2012), “Use of numerical simulation for water area observation by microwave radar”, Journal of the Korean Society for Marine Environmental Engineering, 15(3), p208-218.
[https://doi.org/10.7846/JKOSMEE.2012.15.3.208]


